
Audit360 is your one stop destination for internal audit reporting. With Audit360 reports and dashboards you can do operations tracking, risk reporting and deep audit analysis. Excel imports and exports are easy to do. You can also export reporting data to other reporting or data warehousing systems or import data from other systems to Audit360 dashboard.
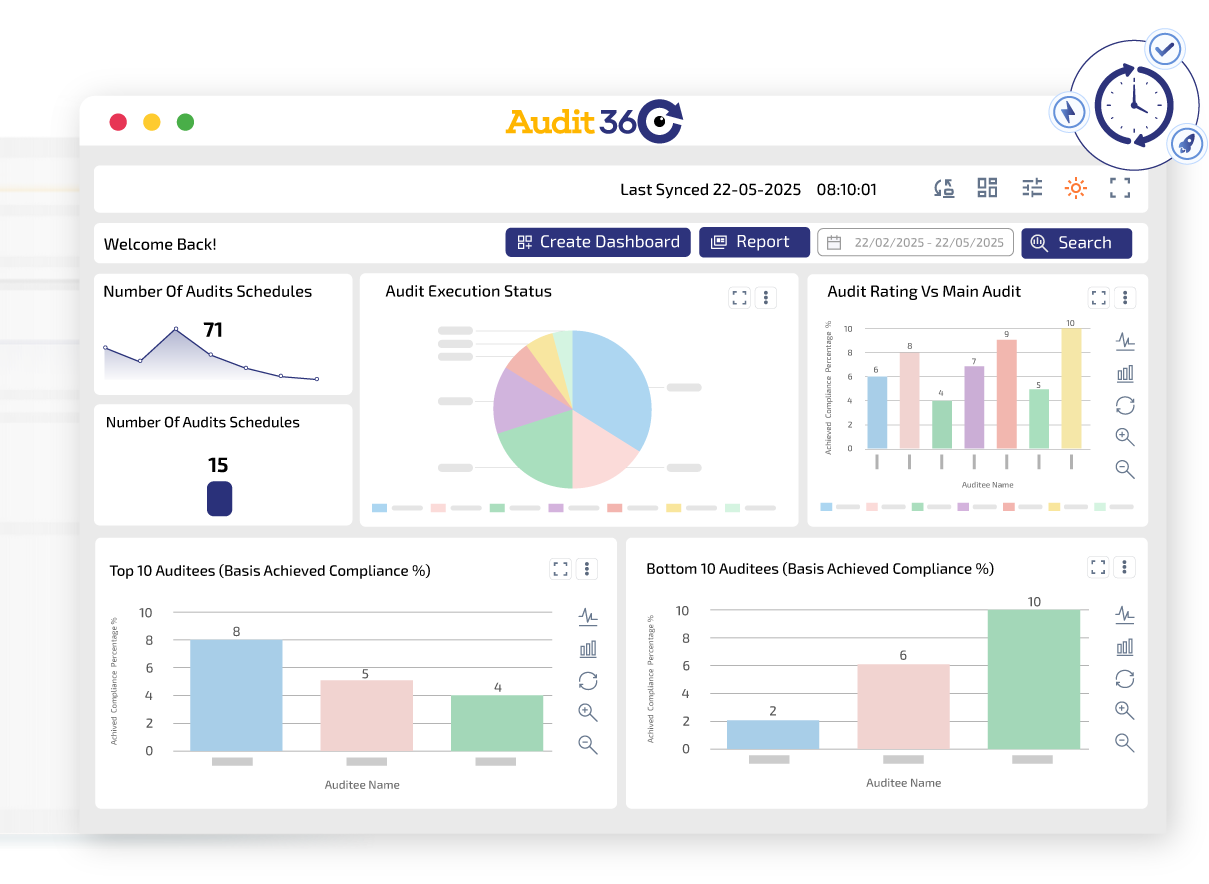
Get reports on most important operations data that needs your immediate attention like top issues, top compliance adherence, percentage of audit completion, audit scores of auditees and worst performing auditees.

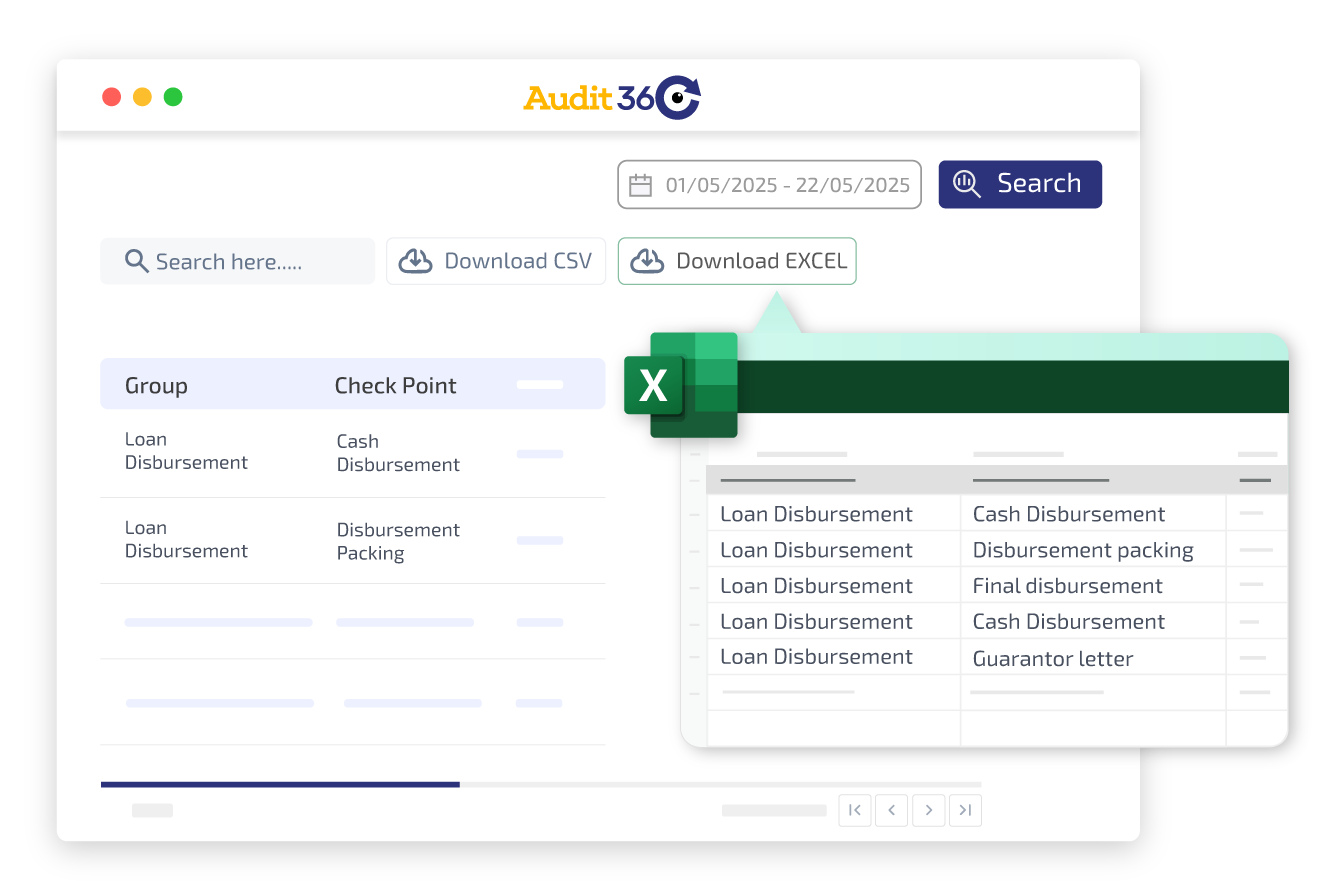
View audit summary and details in one report. Export the data to a formatted excel. Easily create more filters and reports.
View issue summary, issue status distribution and issue aging reports. These reports help you prioritize actions to be taken for issue closure. Export these reports to excel for further filtering & sharing.

Reproduce your existing excel reports precisely with your custom layouts, fonts and colors. Get proprietary risk calculation logic and formulae incorporated in reports in no time.


Once a custom report is built, the data is automatically fetched from Audit360. Say goodbye to laborious ways of reproducing same report for every audit committee meeting.
Get daily planning and execution dashboards. Easily filter data by region, location, issue, audit, checkpoint, statuses, auditee & more. Very useful for day to day operations management. A gem for managing agile audits.


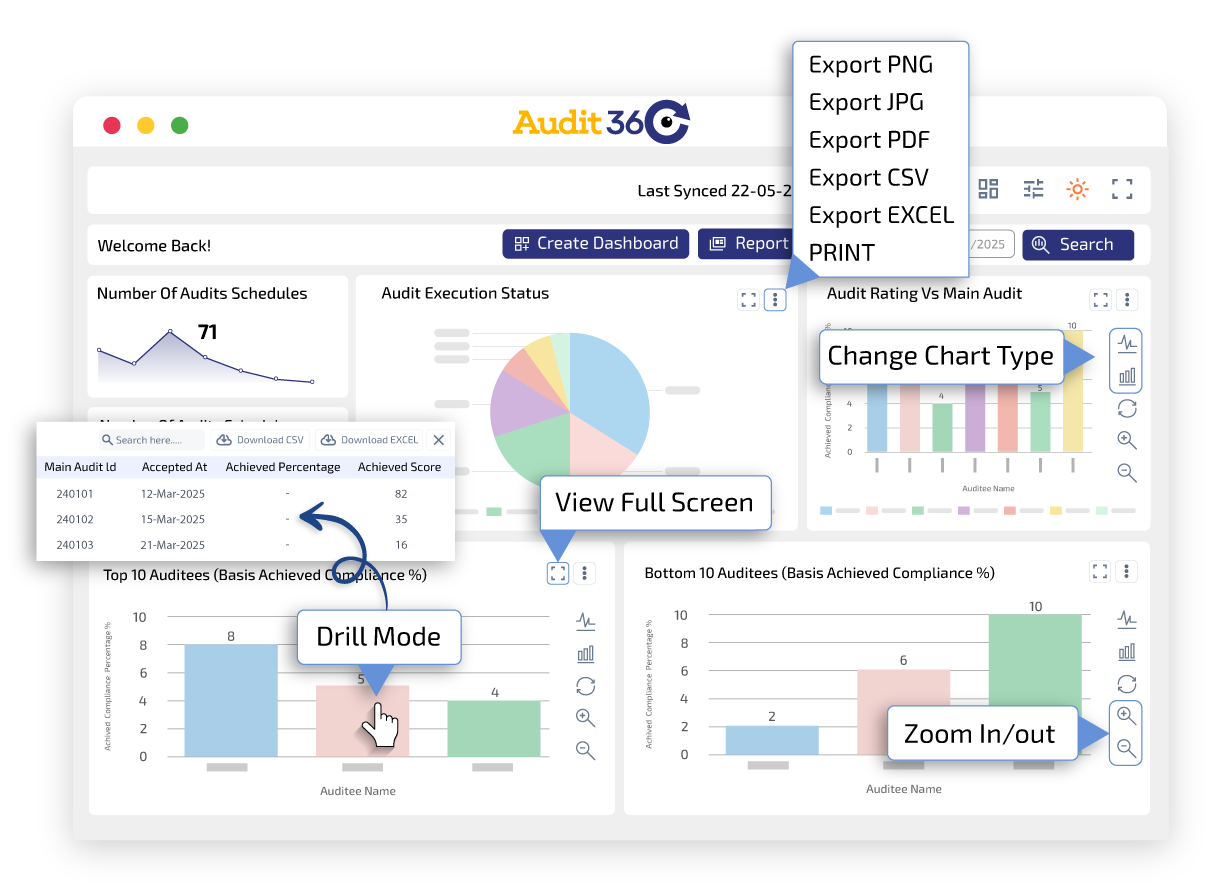
Use conformance dashboard to get current execution and audit scoring statuses. Set time period for data to be displayed and even drill down to last transaction. Get data visualizations that let you analyze information across multiple dimensions. You can discover new trends for audit scores visually by slicing, dicing & filtering data, which was earlier not feasible with excel reports.
Using compliance dashboards you can visualize compliance across multiple dimensions like issue statuses, checkpoints, auditees, risk levels, region, branch, ageing, etc. Analyze trends like issue recurrence by branch. Visualize how risk levels have changed overtime using monthly risk heat maps. You can even correlate issues to events. And if you discover an insight, you can share it with stakeholders in seconds.

Customize your experience with a sleek dark mode or a classic normal mode -
your dashboard, your way.


Top & Bottom 10 Auditees: Analyze top and bottom-performing auditees with drill-through reports and customizable charts.
Access key audit data in one place. View performance metrics, issue summaries, and audit progress so you can stay informed and act quickly.


Create unlimited personalized dashboard views with widget groupings that match your workflow.
Get accurate data and real-time updates for better, faster decision-making.
Navigate seamlessly with a modern UI designed for efficiency. The enhanced layout ensures ease of access to key insights.
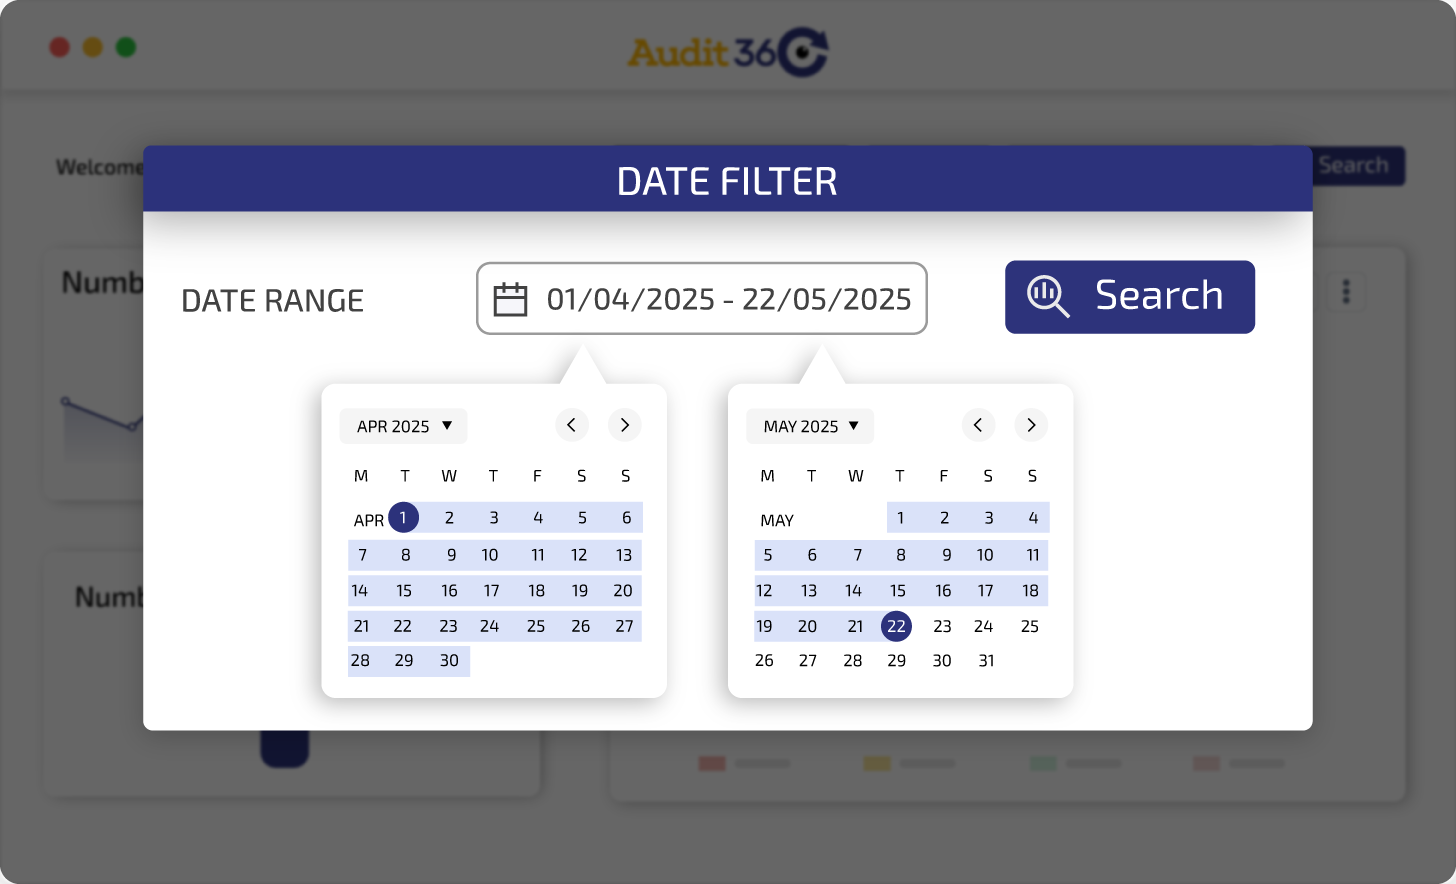
Filter dashboard data across multiple parameter in one go

Drill through to underlying audit and issues data

Reveal distribution of issues by drilling across multiple parameters

Drill across iteratively like a query. Queries on your fingertips
Bangalore Corporate Office
Clayworks Shankara, 2nd Floor,
No. 82/2, H&G Shankaraa
Doddakallasandra, Kanakapura
Main Road Bengaluru - 560062


Copyright 2026 Sumeru Technology Solutions Private Limited

